Mapping recent development trends in Victoria
- Russell Prentice
- Jun 11, 2018
- 4 min read
While it is true that the team here at LGeo is not tremendously fond of the word "insight", we do very much like conducting geospatial analysis and identifying potentially interesting data that creates conversations and confounds strongly held beliefs. To this end, we have been working with a development company in Victoria called Aryze Developments. Not your typical developer, Aryze is attempting to build housing in Victoria for the so-called "missing middle". That is to say, neither high-rise developments nor single family homes, but primarily townhouses and small apartment buildings. To further that aim, they seek to re-frame the conversation around low-rise development on their highly engaging Talk To Aryze website. As part of their efforts, they are trying add more information to the land use and development conversation in Victoria, BC, A LOT more. Happily we are here to help.
BACKGROUND
As with all things land use and development-related, we knew that there were data floating around that could help us answer a few key questions about what has been going on in the City recently:
What are current development trends in the City by dwelling type
What are the permitted zoning patterns in the City, how much of the City of is zoned for multi-family dwellings?
What are the land use patterns in the City, which developments are occurring on what designations? and
Which neighbourhoods are seeing the greatest levels of development by dwelling type?
All of these questions are structured to help us understand land utilization and development, critical topics in today's rather heated housing market.
WHAT WE DID
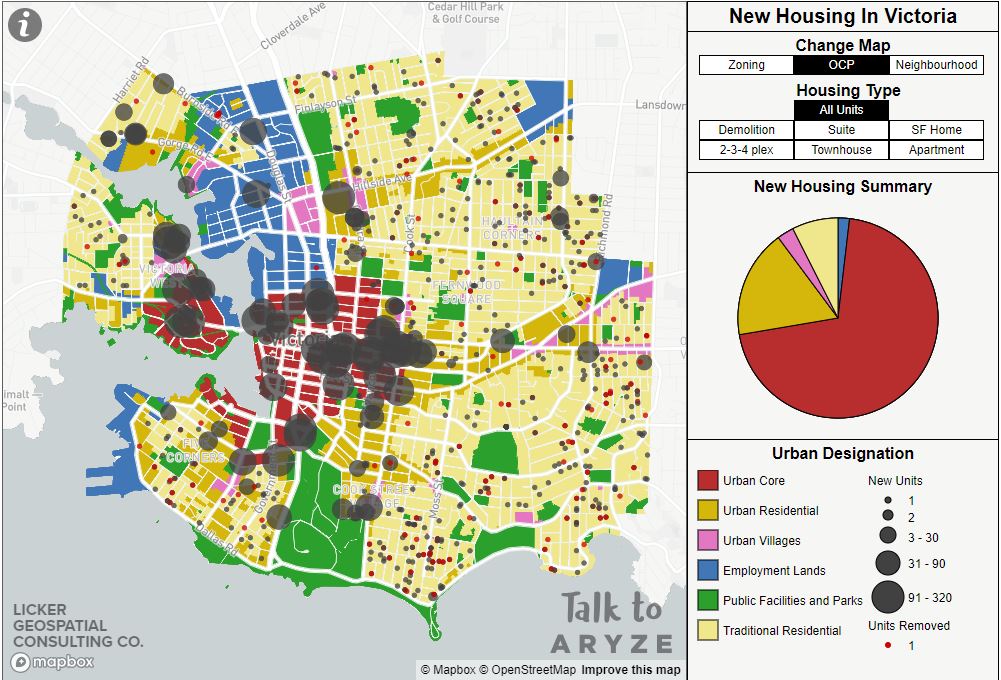
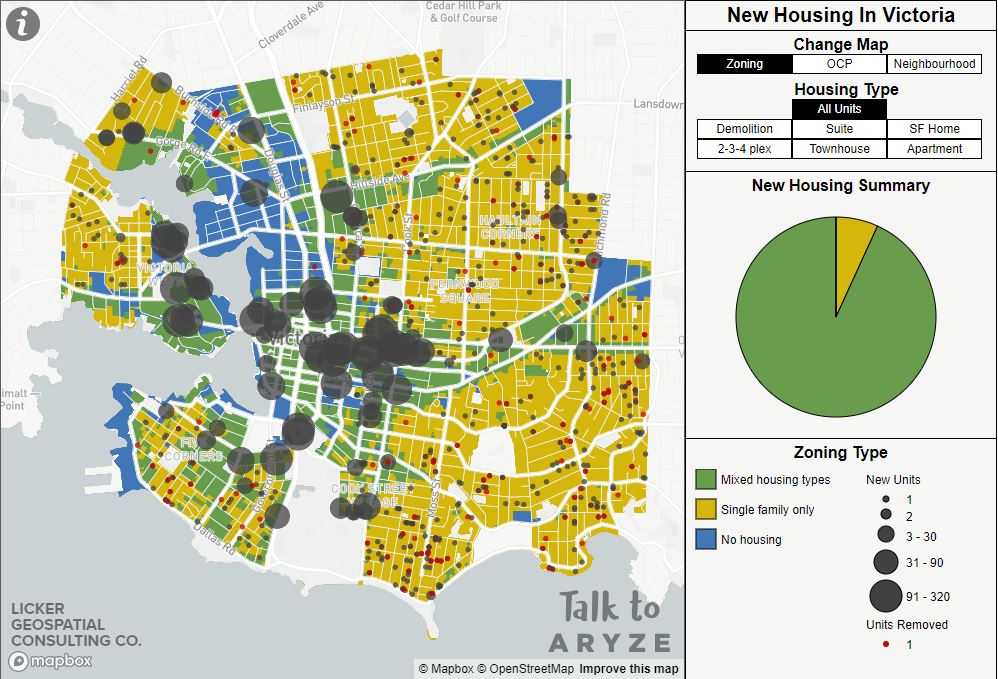
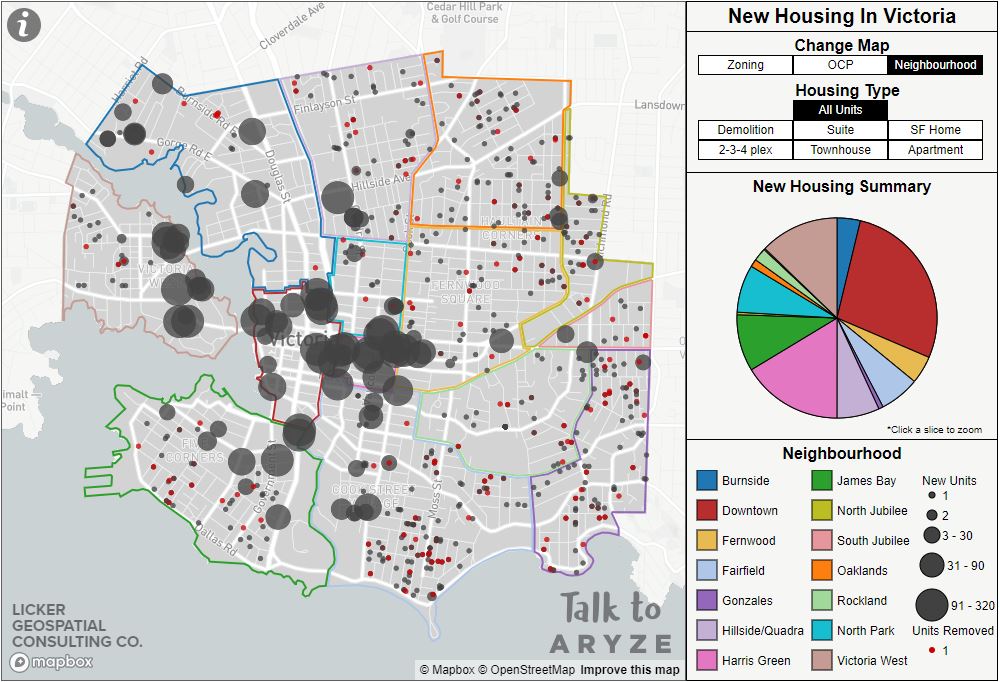
For the base layers, we have divided the city into Residential Zoning Bylaw Classifications , Official Community Plan Urban Designations (OCPs) and Neighbourhoods. The zoning bylaw classifications were created by individually reading through each by law (!!!) and assessing whether or not the zone allowed for multi-family dwellings. While the OCP classifications were created by grouping them into similar thematic groups. Happily, the Neighbourhoods were simply pulled from the city of Victoria’s open data portal.
Obtaining a complete dataset of every residential development in Victoria proved to be a lengthy task. Initially, the data was compiled by carefully combing through Building Permits issued by the city of Victoria. However, this data source was discovered to be missing quite a few key developments throughout the city. Additional sources were required, for which we turned to the Citified and BC Assessment. Even with these additional sources, there is no guarantee that this data has captured every development, but it is certainly complete enough to reveal interesting trends in how Victoria is developing as a city.67
The data was then categorized into housing types, namely suites (i.e. Basements or garden suites), single family homes, 2,3, 4 plexes (i.e. duplex, triplex or fourplex), townhouses and apartments (including condos). We then aggregated the data so the total number of new residential units in each zoning type, OCP and neighbourhood was summed up. We then used these totals and the area of each designation in order to determine the density of new units added to each zone, in units per hectare.
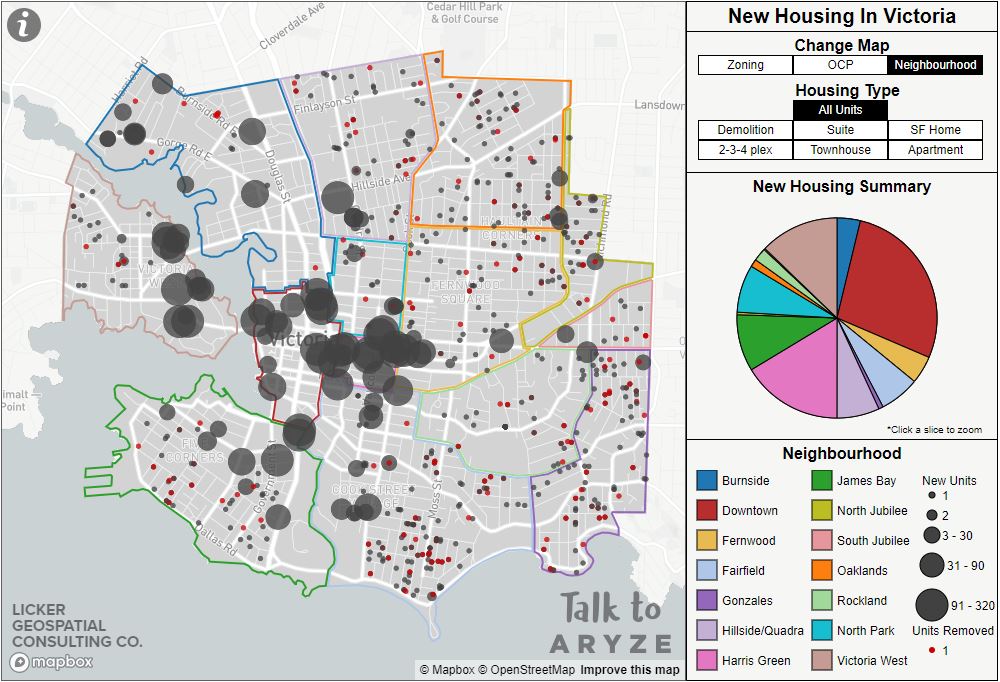
Finally, with a bit of Mapbox and D3.js magic, all the data was visualized on this interactive map.
WHAT WE FOUND
67% of zoned land that allows for housing is zoned exclusively for single detached dwellings and suites (738 ha).
On these single detached lands only 380 net new units (new construction after demolition) were constructed (or suited as the case may be), which amounts to 6.8% of all new housing between 2011-2018. In terms of density, this equates to an astonishing increase of 0.05 units per hectare per year.
Conversely on multi-family lands there were 5,251 net new units constructed (93.2%). In terms of density this equates to an overall increase of 1.35 units per hectare per year or 28 times the density increase in single detached areas.
63.4% of designated land that allows for housing is designated as "traditional residential" (677 ha), on these lands we saw 7.4% of new dwellings constructed. Conversely the "urban core designation which only accounts for 12.2% of land designated for housing accounted for 70.3% of all growth!
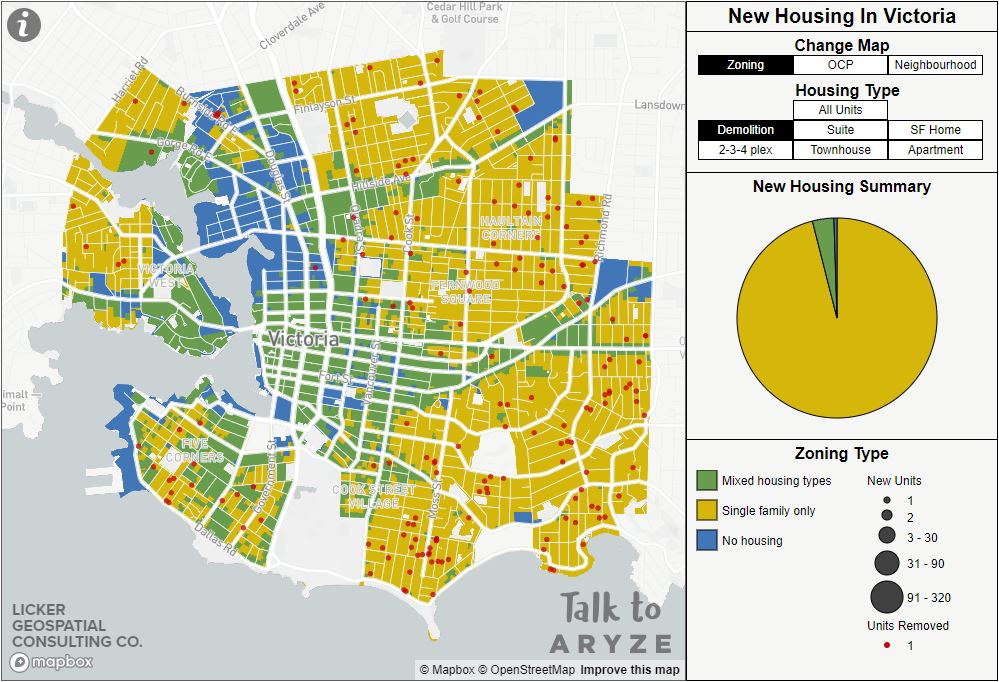
In 8 years we located 180 demolitions of single detached homes... this is about 0.3% of the single detached housing stock per year.
of the 5,700 constructed units that we mapped, only 2.3% (141) of them were townhouses or "plex style" developments.
The vast majority of constructed units in the City were apartments at 88.3% (5,0126)
Five neighbourhoods (Downtown, Harris Green, Vic West, James Bay and North Park) accounted for 73.7% of all net new units constructed.
Conversely, the five neighbourhoods (South Jubilee, North Jubilee, Gonzales, Oaklands and Rocklands) account for only 4.7% of growth (263 net new units)
Analyzing OCP designations has yielded some interesting findings:
We noticed that 70% of unit growth occurred in the Urban core, compared to 17% proximal to Town Centres and Urban Villages and the remaining 13% in the remainder of the City.
This can be directly compared to aspirational targets in the OCP which have the Urban Core at 50%, Town Centres/Urban Villages at 40% and the remainder of the City at 10%.
The real question is: will these trends continue or will development follow policy??
Want to learn more check out the map here
HOW TO USE THE MAP
Use the buttons on the right-hand side to change the base layer and filter the housing types. The pie chart will give you a summary of the new housing data based on the housing type filter and base layer buttons you have pressed. Mouseover each slice of the pie chart for more detailed statistics and an explanation of what they represent. You can also mouseover the squares in the legend to highlight the respective portion of the base layer on the map. For more information and data sources, click the “i” button in the top left-hand corner. In addition, when the neighbourhood layer is selected, you can click on a legend square or pie chart slice to zoom to that neighbourhood.








Comments