
Empowering Local Climate Change Planning with GIS and Data Science
- Gaby Baasch
- Jul 9, 2024
- 7 min read

When I tell my friends and family about my job at LGeo the response that I get is fairly ubiquitous: “I don’t understand what you do and how that relates to climate and energy!”. This is typical of the professional climate that we work in, where our roles are increasingly specialized and there is an ever changing job market. What is somewhat more surprising, though, is that this statement is typical from others who work in these fields, be it data scientists, GIS analysts or energy modeling experts.
Before LGeo, I had no GIS/geospatial analysis experience whatsoever, and no sense of the answer to what any one does at a geospatial-forward company. Since then, I must say, I have drunk the GIS-kool aid. We live in a spatial world and - although it was never mentioned through most of my data-oriented undergraduate and masters programs - most data and information is, accordingly, spatial!
This is the first in a series of blog posts that will demonstrate to you (data or GIS analyst, software developer, carbon and energy policy specialist, or general nerd [thank you for being here]) how we integrate these typically isolated fields to provide real insights for cities and, hopefully, contribute to mitigating or adapting to climate change.
The series will include the following posts:
Understanding the Current State: A Case for Inventorying
Understanding the Future: Land Use Change, Urban Planning and Capacity Analysis
Adaptation Planning
Integrated Equity Analysis
Closing the gap: Helping Municipalities Address their Most Challenging Sectors
Most of the work we do is private so, for the purpose of this series, I’d like to introduce: LGEOpolis!

LGEOpolis is a little-known city tucked away on the Olympic Peninsula. Like other municipalities in British Columbia, it has set climate targets for its transportation and buildings sectors, which contribute the majority of its greenhouse gas (GHG) emissions. The City also knows that it is vital to: (1) reduce energy use; and (2) move off of fossil fuels - and fast. Moreover, this all needs to be done in an equitable manner.
Now that the City has their targets and goals in mind, it needs to decide how it should design its energy and emissions policies. This, unsurprisingly, can be challenging without the right information. Enter….. GIS & Data Science.
Understanding the Current State: A Case for Inventorying
Cities have access to a plethora of interesting data and information, but it is often distributed across departments, systems and formats that are challenging to process or integrate. Additionally, due to the nature of the information storage, municipal staff are often unaware of what data is available let alone who the custodians are and what are the considerations for access!
At LGeo, we use our geospatial expertise and contextual moxie to stitch together all this data to provide more useful information for our clients. While this may sound dry, this can take an immense amount of creativity as we consider new approaches for integration, synthesize learnings from different disciplines and discuss our results with various domain experts.
The first few questions a city might ask when considering how to design municipal policy for buildings and transportation include:
How many buildings are in the City, and where are they located? How many are there of each type (offices, apartments, homes, restaurants, etc.) and what size are they? What equipment do they use for heating, cooling and domestic hot water? How many emissions do they produce?
How do people move around the City? Do most folks drive, bike or take transit? Where are people purchasing electric vehicles and where are they charging them? Are there any barriers to electric vehicle adoption?
Notice that these questions have a geospatial component, that is, considering location as well as stock-level totals. This is where our data expertise comes in handy, and also where we believe lesser-reached opportunities lie for high-impact policy design.
The examples below show some ways in which we’ve addressed these questions. These are by no means exhaustive, but they demonstrate the power of the geospatial information and the potential for localized policy design.
Building Stock Characterization for Retrofit Policy Design

Using tax assessments (System of record 1), building footprints (system of record 2) and a wide variety of other sources such as retail storefront data (System of record 3), industrial lands information (System 4) and permit data (system of record 5 through 10!), we are able to create an integrated inventory of buildings, by their primary and secondary uses. As an example here we have shown residential and non-residential buildings, but we typically include over 10 different building types, depending on the City’s policies.
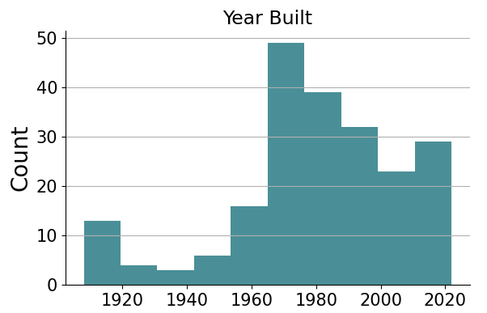
We include a plethora of useful information in addition to building type including, but not limited to, number of units, size, age, assessment value, and ownership. All of this is integrated using a combination of geospatial processes and automated data pipelines.

We take our building inventory further by integrating address-level permit data and energy assessments, as well as image detection algorithms, to identify mechanical equipment at the building scale. This is hugely impactful for climate action, since it helps to identify specific addresses and areas that require electrification and that are good candidates for heat pump adoption.
Once we integrate our building inventory with our mechanical equipment inventory, we use previously calculated energy use intensities (that is to say the archetypical energy use of a building based on its mechanical and structural systems) to offer an indicative estimate of emissions, at the building level. Of course, benchmarking programs are still required (building level modeling will never be accurate without measured data) but these will take some time to implement. In the meantime, this helps Cities to develop a preliminary understanding of exactly which buildings are the highest emitters, and where they are.
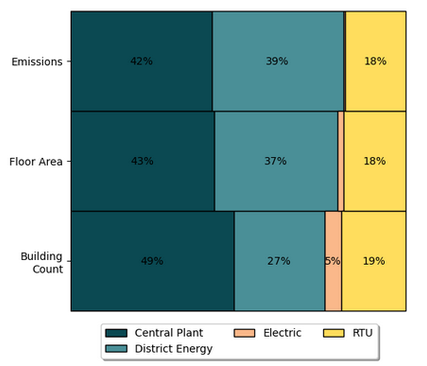
This geospatial information can of course be summarized further to inform policy design. As an example, the image below shows a stock-level summary of emissions from all non-residential buildings in LGEOpolis, by size category (50k - 100k sqft and >100k sqft).

Based on this image we can see that offices have the highest cumulative emissions compared to other building types, so policy makers at LGEOpolis would be wise to target office buildings for reductions. As such, further summarization of office buildings can be provided.


Based on these results, how would you suggest that LGEOpolis design its building retrofit policy for offices?
Vehicle Stock Characterization for Charging Infrastructure and Active Transportation Policy Design

The image above showcases the results we get from using vehicle insurance data as a proxy to understand where vehicles in the City are likely to reside. We can use this data in concert with land use and demographic forecasting to predict how many vehicles there will be in the future, and where they will reside. Further, we can change the inputs in these predictive models to understand how LGEOpolis policies will impact future vehicle stock ownership (to be discussed further in an upcoming blog post).
With this geospatial information in hand, we integrate a variety of additional sources to derive further insights, including
Demographic information, to understand barriers to electric vehicle adoption, and associated equity considerations. This can help with policy design in a number of ways, including targeted education and incentive programs.
Data on parking and existing charging infrastructure to inform the design of charging infrastructure strategies.
Survey data, origin-destination matrices, transportation ridership counts and biking network infrastructure to estimate driving behavior and mode share (the amount of trips taken by vehicle vs. other modes of transportation). This is fundamental information for the design of active transportation policy.
A Case for Inventorying
At LGeo we strongly believe that an important next step in climate action planning is developing an understanding of the current state. As such, the following list offers a set of directions and initiatives that LGEOpolis might be interested in, and which we can support using our inventorying work:
Design of Financial Programs - Once we know the number of buildings, mechanical systems, and vehicles in a community, we can estimate the capital cost of electrification. Further, we know the amount of energy and fuel consumed by each piece of equipment, so we can estimate cost of use as well. This insight into household costs and savings informs the design of appropriate rebate, subsidy and loan programs. Moreover, by integrating spatial demographic information, we can assure that equity considerations are included in program design.
Workforce Training - Similarly, once we know the amount of equipment that needs to be replaced or upgraded (e.g. building envelopes to be retrofit), we can understand the amount of trained professionals that will be required to get the job done in a timely manner. Access to well trained resources is a huge bottleneck to climate action, and a huge opportunity for job creation. Our inventorying work presents a huge opportunity here.
Government Procurement of Equipment - Everyone wants to keep household costs low as the energy transition ensues, and proper planning presents the government with a huge opportunity. If they know the amount of equipment that needs to be replaced or upgraded, and they design the correct policies to encourage this adoption, then they can plan in advance and purchase the required goods in bulk, in turn offering discounted rates to consumers.
Conclusion
We hope that the above examples start to showcase why we believe that geospatial building and vehicle inventories to understand the current state are invaluable for policy planning. That said, we think what we have shown here is only just scratching the tip of the iceberg. Developing an inventory of the current state is essential in understanding what will be required to move off fossil fuels and, accordingly, is fundamental for planning purposes.
If you are tackling some of the same questions as LGEOpolis, or if you are curious to learn more about our work, we want to hear from you! Let's talk GIS, Data Science and Carbon and Energy.


Comments